SWFL Housing Market | November 2023 Update
There’s been a lot of public uncertainty about the state of the SWFL housing market as of late. With U.S. interest rates reaching 20-year peaks and escalating conflicts overseas, it’s reasonable to feel skeptical and have questions about our local housing market.
To clear the air, we’ve compiled all of the stats that best indicate the condition of the SWFL housing market, including: home prices, inventory levels, buyer demand, and foreclosure rate. Here are the facts:
Home Prices

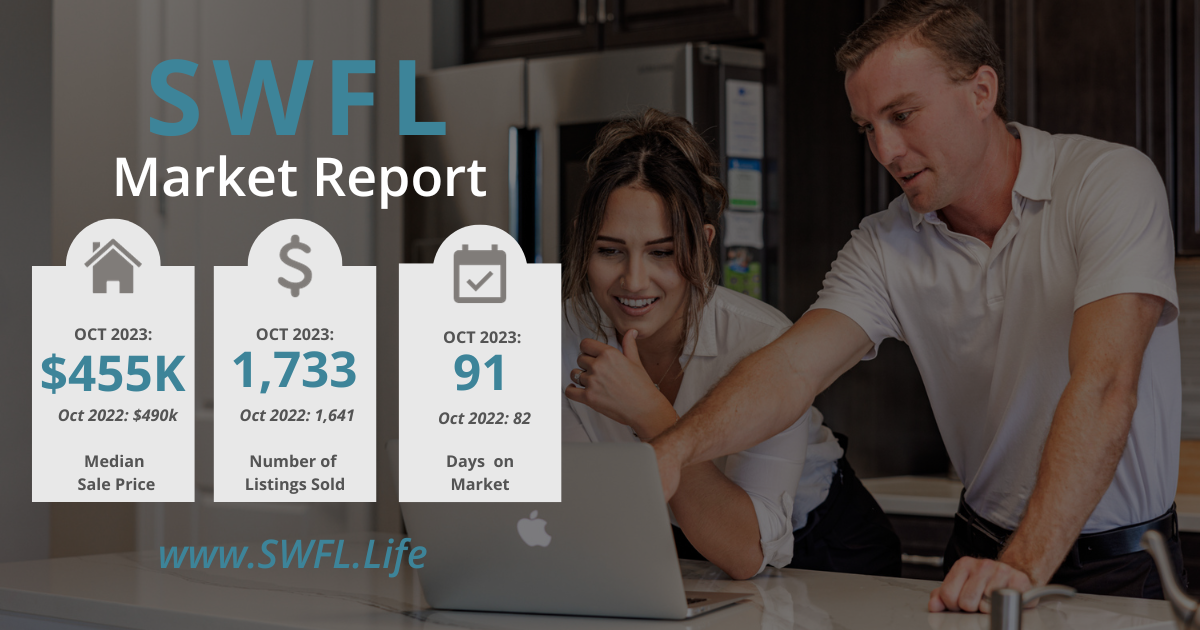
Figure 1 above shows the median sale price across Lee and Collier Counties from October 2022 through October 2023. For the past 12 months, we’ve been bouncing between about $425,000 and $460,000. In terms of sale prices in SWFL, higher mortgage rates haven’t affected us in the slightest. In fact, many SWFL cities have increased their median sale price over the past year! Below are the past 12 months of median sale prices, broken down by city:
- Bonita Springs | October 2022: $560,000 | Now: $602,000
- Naples | October 2022: $561,500 | Now: $605,000
- Estero | October 2022: $545,000 | Now: $590,000
- Fort Myers | October 2022: $389,000 | Now: $365,000
- Marco Island | October 2022: $970,500 | Now: $1,135,000
- Cape Coral | October 2022: $415,000 | Now: $388,000
Housing Inventory
Perhaps the most insightful housing market indicator is our inventory levels. The phrase, months of inventory, refers to how many months it would take to sell ALL of our current listings, at the current rate of sales. Meaning, if we had 1,000 listings in our MLS, and we were selling about 1,000 homes per month, we would have one month worth of inventory. Typically, zero to four months of inventory is considered a seller’s market, where the seller has more negotiating power due to lack of inventory. Four to six months is a healthy, balanced market. Six or more months worth of inventory would be considered a buyer’s market, where the buyer holds more negotiating power due to an abundance of available homes.

As shown in the above graph, our inventory levels really jumped up in October 2023. This is the first time since pre-covid that we’ve had more than 7 months worth of inventory, and it is a direct market response to the higher interest rates we’ve been seeing.

Don’t be afraid, though, sellers! Even though our inventory levels are rising and less buyers are in the market, expired listings have actually been on a downward trend since June 2023, and are significantly lower than our October 2022 numbers. This is evidence that correctly-priced homes are still selling, and for the most part, pretty quickly!
Days on Market

The days on market indicator measures the median total number of days that a property is on the market before accepting an offer. While it has been ticking up, we’re still seeing the majority of homes go under contract within 35 days of listing. While our inventory levels may indicate a buyer’s market, the days on market says otherwise. 35 days on market is a pretty balanced number, giving buyers enough time to find the perfect home, but still selling fast enough to not lower our median sale prices, keeping sellers happy.
Foreclosures

With higher interest rates and home prices, we’ve seen some concern of another 2008 situation happening in the future. As of now, foreclosures virtually non-existent. The above graph goes all the way back to October of 2019, where we had lots of months of 200+ foreclosures on the market. Currently, we have about 30 foreclosures on the market, and holding steady.
Additionally, in 2019 we had over 100 short sale listings on the market. We currently have about 10.
Summary
No one knew exactly how the housing market would respond to 20-year-high interest rates. The Fed had to do something to combat inflation, and the best they could hope for was that the housing market makes a “soft landing,” cooling off slowly instead of plummeting in value. We feel this data indicates just that: a slow cooling off period without affecting values very much at all. Buyers now have more opportunities and a bit more negotiating power (they deserve it after going through 2021!), but sellers are also happy because their homes are still selling quickly and for just as much, if not more, than during the 2021 boom.
Florida will always be a place people flock to. With lots of new commercial developments in all of Southwest Florida, and interest rates expected to come down in 2024, we think our market and home values will continue to grow for years to come.
Build your FREE profile on our cutting-edge home equity tracking tool, Homebot A.I. This Artificial Intelligence software allows you to see the potential sale and rent value of your home, and provides helpful tips to help you use your home equity to grow wealth. With countless more features than other online home value estimators, Homebot A.I. is truly the best in the biz.


Good article, thanks
Jaci